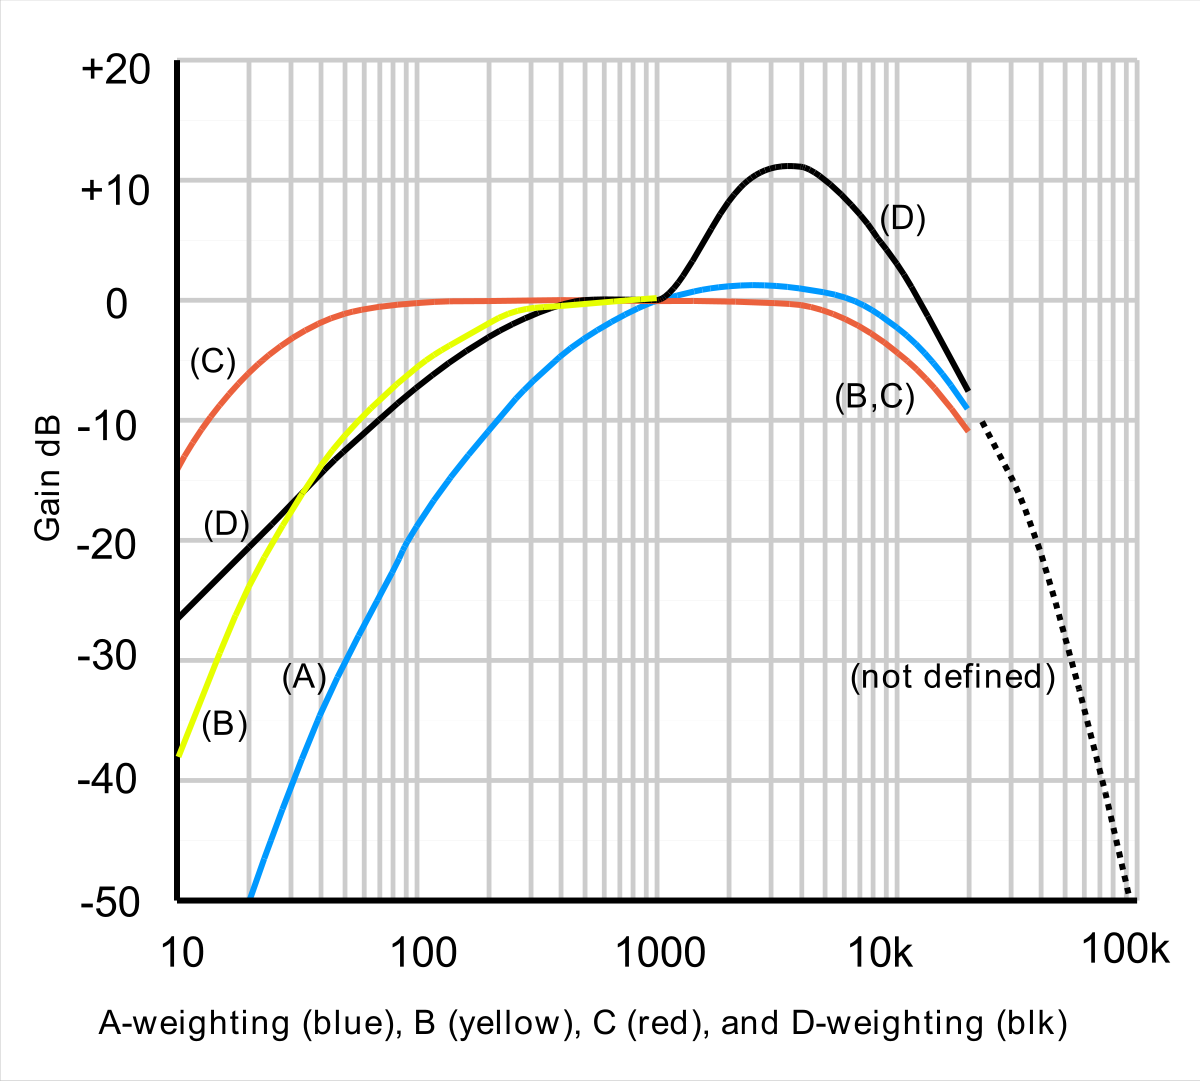
Reference
A complete guide to decibels, frequency weightings, measurement parameters, and statistical noise levels — the terms used in professional noise monitoring.
Glossary
The fundamental measurement of sound, expressed in dB or dB(A). Represents the pressure variation caused by a sound wave relative to a reference pressure.
A frequency weighting that takes into account the sensitivity of human hearing. Our ears perceive high-frequency sounds as louder than low-frequency sounds at the same pressure level. A higher dB(A) value always sounds louder to humans than a lower one. The most commonly used weighting for environmental and occupational noise.
A frequency weighting that gives more emphasis to low frequencies. Used for peak measurements and assessing low-frequency noise such as bass from music or machinery.
Also called linear or flat weighting. No frequency weighting is applied — all frequencies are treated equally. Used in specialized acoustic analysis.
The maximum level with A-weighted frequency response, measured with a Fast or Slow time constant. Represents the highest noise peak during a measurement period.
The minimum level with A-weighted frequency response during a measurement period. Represents the quietest moment recorded.
The true peak sound pressure level without a time constant applied. Typically 3 dB higher than Lmax. Used to assess impulsive noise events such as hammer blows or explosions.
The equivalent sound pressure level averaged over a given time period. Represents the steady-state sound level that would contain the same acoustic energy as the actual fluctuating sound. The most important single value for assessing noise exposure.
A continuously updated Leq — also called running Leq. Shows how the equivalent level evolves over time in real-time.
The sound level that is exceeded 10% of the time during a measurement period. Represents louder noise events.
The sound level that is exceeded 90% of the time during a measurement period. Represents the background noise level — the quieter baseline.
The sound level exceeded xx% of the time. SpotNoise SP008A measures any Ln value (L1 through L99), giving a full statistical picture of noise distribution over time.
Divides the measured sound into standard octave frequency bands. Useful for identifying which frequency ranges (bass, mid, high) dominate the noise.
Divides the measured sound into narrower third-octave frequency bands for more detailed frequency analysis. Available on SpotNoise SP008A.
Frequency weighting
The weighting curves show how each filter emphasises or de-emphasises different frequencies. dB(A) closely matches human hearing; dB(C) preserves low frequencies; dB(Z) is flat across the full spectrum.
Reference chart
All values measured at 1 metre distance unless otherwise noted.
Read our in-depth guide on noise monitoring, WHO guidelines, and real-world case studies. Or contact our engineers for a free initial consultation.